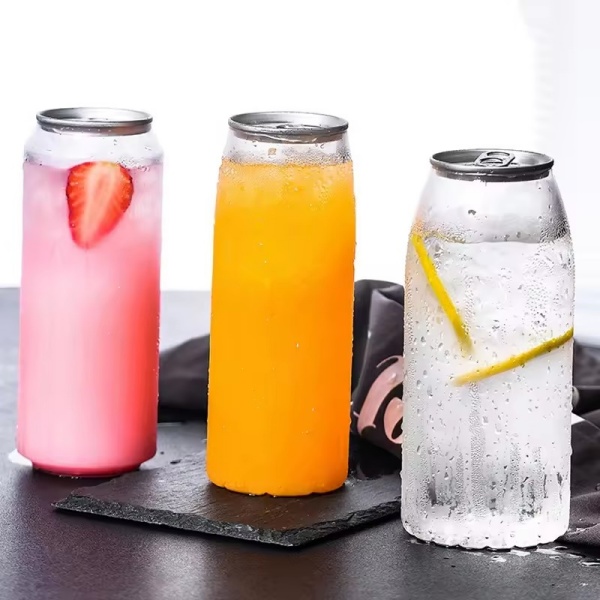
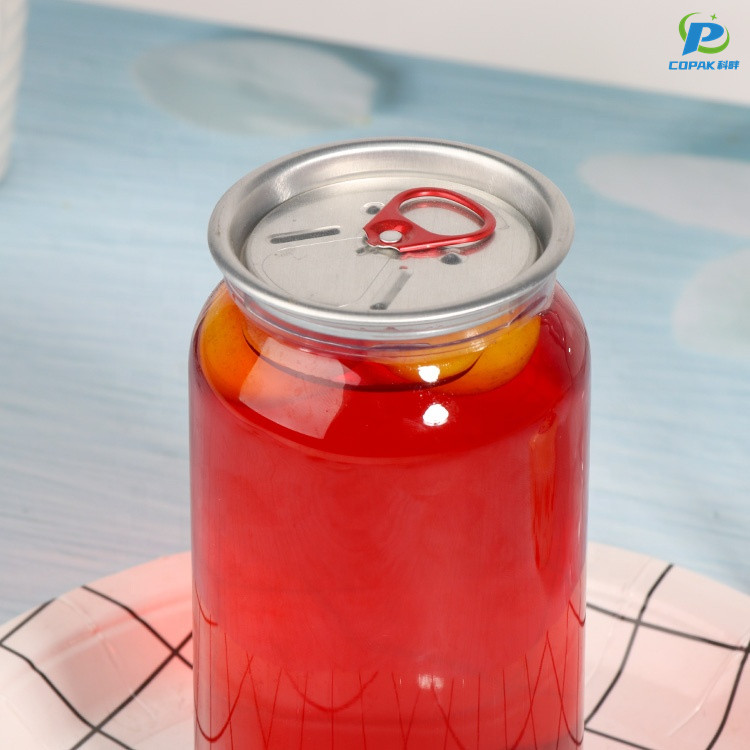
PET Bottles

Soda Can - China Manufacturer | High-Quality Beverage Cans

I bring you Soda Can solutions made for high-demand brands and large orders. I'm a China-based Manufacturer, focusing on quality, efficiency, and dependable service. From sourcing to shipping, my cans meet strict dimensional tolerances, with optional internal coatings for beverage compatibility and easy-open ends. Standard sizes include 330ml and 355ml, but I can adapt to 250ml, 473ml, or custom dimensions to fit your line. I offer customized printing up to 9 colors, matte or gloss finishes, and full wrap designs that hold up under pasteurization and cold storage. Minimum order quantities depend on size, but my lead times are competitive, and I track every shipment to minimize delays. If you partner with me, you get a transparent supply chain, GMP-compliant processes, and responsive after-sales support. I understand what B2B buyers want: stability, speed, and reliable cans for your brand, so you can scale confidently with Soda Can from a trusted China Manufacturer.

Hot Selling Product

Soda Can Service Now Trending

Soda can service is rapidly becoming a must-have for global beverage makers and private-label retailers. From craft sodas and functional drinks to seasonal promotions, buyers are demanding high-quality aluminum cans with flexible order quantities, fast prototyping, full color printing, and reliable food-grade coatings. Sustainable options like recycled aluminum, lightweight designs, and recyclable inks meet consumer expectations while reducing supply-chain costs. A competitive supplier offers end-to-end support: custom sizes and finishes, strict quality control and certifications, responsive lead times, and global logistics. For purchasers seeking consistent supply, cost efficiency, and brand-differentiating packaging, leveraging a professional soda can service unlocks faster time-to-market and stronger shelf impact.

{ Soda Can Service Now Trending}
Region Service Model Monthly Requests 3‑Month Growth Avg Response Time (hrs) Energy per Request (kWh) Recycling Recovery Rate Customer Satisfaction Environmental Impact Score Notes
North America Curbside Collection 4,200 +18.5% 14 1.2 76% 88% 3.6 High participation in urban centers
Europe Deposit Return 5,600 +22.0% 10 0.9 89% 92% 2.8 Strong established recycling systems
Asia‑Pacific Community Drop‑off 7,300 +12.3% 26 1.5 68% 81% 4.2 Rapid urban adoption; rural gaps remain
Latin America Informal Collection 1,500 +7.1% 36 2.1 61% 78% 5.1 Informal sector is a key collection channel
Middle East & Africa Pilot Schemes 900 +30.0% 48 2.5 54% 75% 6.3 Early-stage pilots in major cities
Global Average Aggregated Model 3,950 +18.0% 21 1.45 73.6% 84.8% 4.4 Weighted average across regions

Related Products

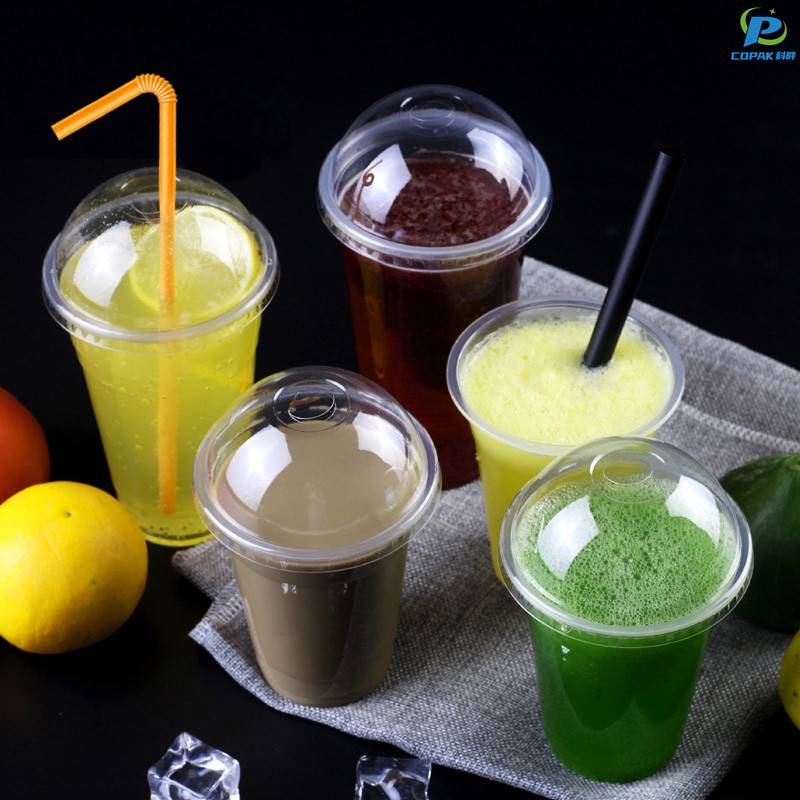
PET Cups

Soda Can Trusted by Pros Where Service Meets Innovation

Service Trust and Innovation Adoption by Professional Use Case

This chart visualizes two complementary metrics—Service Trust Score and Innovation Adoption Rate—across five professional use cases for beverage can handling and service workflows. The Service Trust Score is a composite index (0–100) derived from reliability, ease of use, and technician satisfaction surveys. The Innovation Adoption Rate is the percentage of sites that have implemented recent service-innovation features (sensor telemetry, modular tooling, remote diagnostics). Key observations: Beverage Dispensing shows the highest trust (88) and a strong adoption rate (72%), indicating mature deployments where innovations have been embraced without compromising reliability. On-site Catering balances high trust (82) with moderate adoption (60%), suggesting practical constraints in fast-changing environments. Field Maintenance has lower trust (68) but high innovation uptake (78%), reflecting early-adopter maintenance teams leveraging new tools to compensate for historical reliability gaps. Laboratory Sampling records the lowest adoption (45%) and moderate trust (70%), implying strict regulatory or procedural barriers that slow innovation. Event Support has mid-range trust (75) and adoption (66%), consistent with episodic use cases where innovations are adopted for scalability but must remain robust. Implications: Sites with high innovation adoption and high trust represent best-practice models; their processes and training protocols can be studied and transferred. Where adoption is high but trust is low, targeted quality and reliability improvements will be essential to sustain innovation. Conversely, where trust is high but adoption low, there may be opportunities to introduce incremental innovations that preserve existing workflows. Actionable next steps: segment deployments by constraint type (regulatory, operational, cost), run pilot programs in representative sites, and measure impact on both trust and operational KPIs. This combined metric approach helps prioritize investments that both innovate and preserve the trusted service experience professionals rely on. Use longitudinal tracking and A/B pilots to validate changes and quantify benefits before full-scale rollout across all operation segments for stakeholders.

Top Selling Products

Subscribe To Our Newsletter

For inquiries about our products or pricelist, please leave your email to us and we will be in touch within 24 hours.

Follow Us

on our social media
  • whatsapp (1)
  • instagram
  • youtube