




Empty Plastic Bottles | China Manufacturer | Leading Packaging
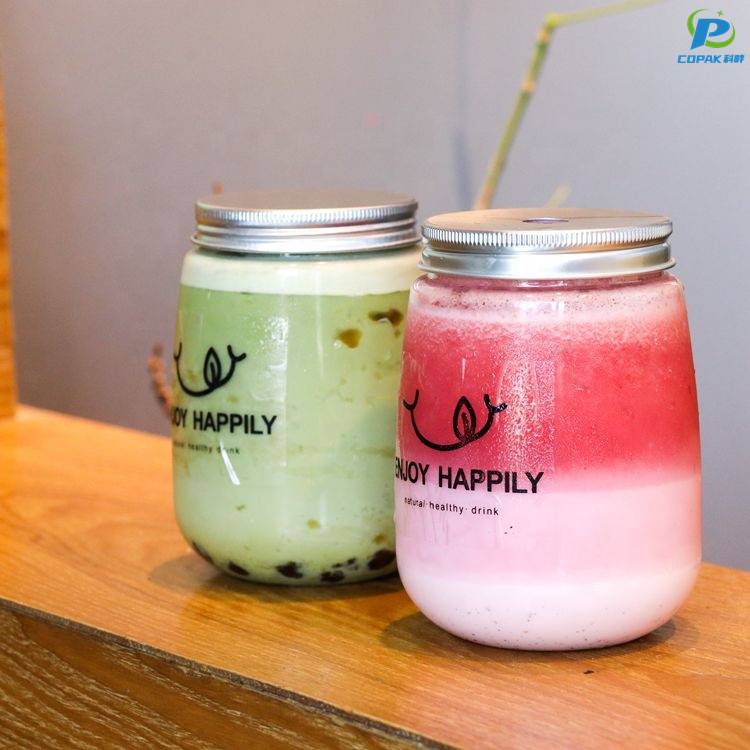
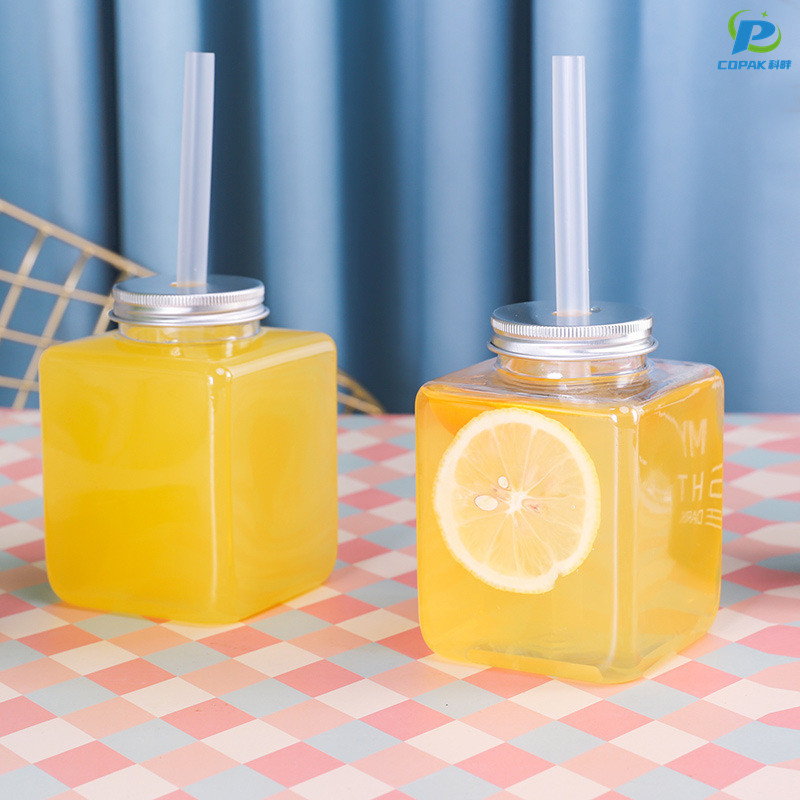
I am a China-based manufacturer delivering reliable Empty Plastic Bottles for global buyers. I know what buyers in B2B markets expect: consistent quality, easy customization, and fast delivery. My Empty Plastic Bottles come in PET and HDPE options, with sizes from 5ml to 1000ml, closures and neck finishes to fit your bottle design. I can supply clear, amber, or blue containers, with smooth edges, light-weight design, and food-grade safety. I offer mold customization for logos, print, and label-ready surfaces. My QC team checks each batch for drop tests, seal tests, and leak resistance, so your products stay fresh. Based in China, I leverage efficient logistics to ship worldwide. Partner with me and you will get competitive price points, stable supply, and responsive service. Ready to discuss your project, I will tailor a solution that suits your bottle demand.



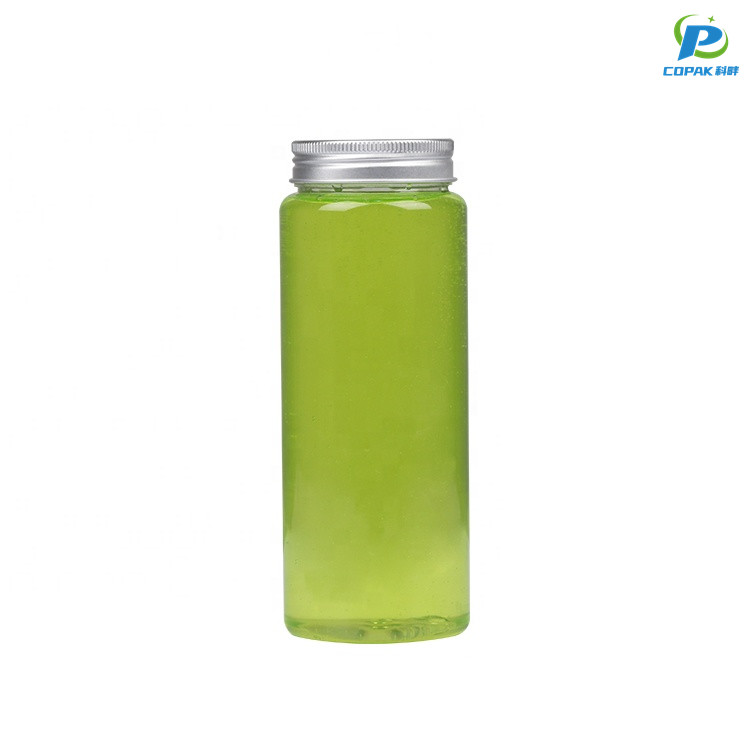


Empty Plastic Bottles Factory Stands Out
An empty plastic bottles factory stands out by combining high-capacity production with precision engineering: advanced blow-molding lines, in-house tooling, and rigorous quality control ensure consistent wall thickness, tight tolerances, and defect-free finishes across a wide range of sizes and shapes. Buyers benefit from flexible customization—neck finishes, closure compatibility, color matching, barrier options, and surface decoration—backed by sample-run capabilities and fast mold turnaround to support product launches and seasonal demand. For global procurement teams, reliability means transparent certification, food-contact-safe materials, sustainable options like lightweighting and rPET, and streamlined logistics with predictable lead times and consolidated shipping. Competitive pricing is paired with responsive technical support, QC documentation, and scalable OEM/ODM services to reduce total cost of ownership and accelerate time to shelf—making the right manufacturing partner an asset for brand growth worldwide.
| { Empty Plastic Bottles Factory Stands Out} | |||||||||
|---|---|---|---|---|---|---|---|---|---|
| Material | Capacity (mL) | Neck Finish (threads) | Common Shape | Wall Thickness (mm) | Recyclability | Typical Use | Dimensional Tolerance | Surface Finish | Estimated Annual Output Range |
| PET (Polyethylene Terephthalate) | 30 – 1000 | 18-400, 24-410, 28-400 | Clear cylindrical, slim, sport-cap | 0.30 – 1.20 | Code 1 | Beverages, personal care, food-grade containers | ±0.15 – ±0.30 mm | Gloss, silk-screen, hot-stamp | 50M – 300M units |
| HDPE (High-Density Polyethylene) | 50 – 2000 | 20-410, 24-410, 28-410 | Opaque pump, round, oval | 0.60 – 2.50 | Code 2 | Household chemicals, detergents, industrial liquids | ±0.20 – ±0.35 mm | Matte, ribbed grip, embossing | 10M – 120M units |
| PP (Polypropylene) | 30 – 1000 | 24-410, 28-410 | Hot-fill, medical vials, wide-mouth jars | 0.50 – 2.00 | Code 5 | Pharmaceuticals, hot-fill food, cosmetics | ±0.18 – ±0.30 mm | Heat-resistant finishes, matte | 5M – 60M units |
| LDPE (Low-Density Polyethylene) | 15 – 1000 | 20-410, custom tapered necks | Squeeze bottles, travel soft containers | 0.40 – 1.50 | Code 4 | Squeeze dispensers, travel toiletry bottles | ±0.20 – ±0.40 mm | Soft-touch, translucent, spray-coated | 2M – 25M units |
| rPET / PCR PET (Recycled PET) | 30 – 1000 | 18-400, 24-410 | Clear or slightly tinted cylindrical | 0.35 – 1.30 | Recycled content | Eco-conscious personal care, non-sensitive food packaging | ±0.18 – ±0.30 mm | Matte recycle-friendly labels, printed | 8M – 150M units |
Related Products
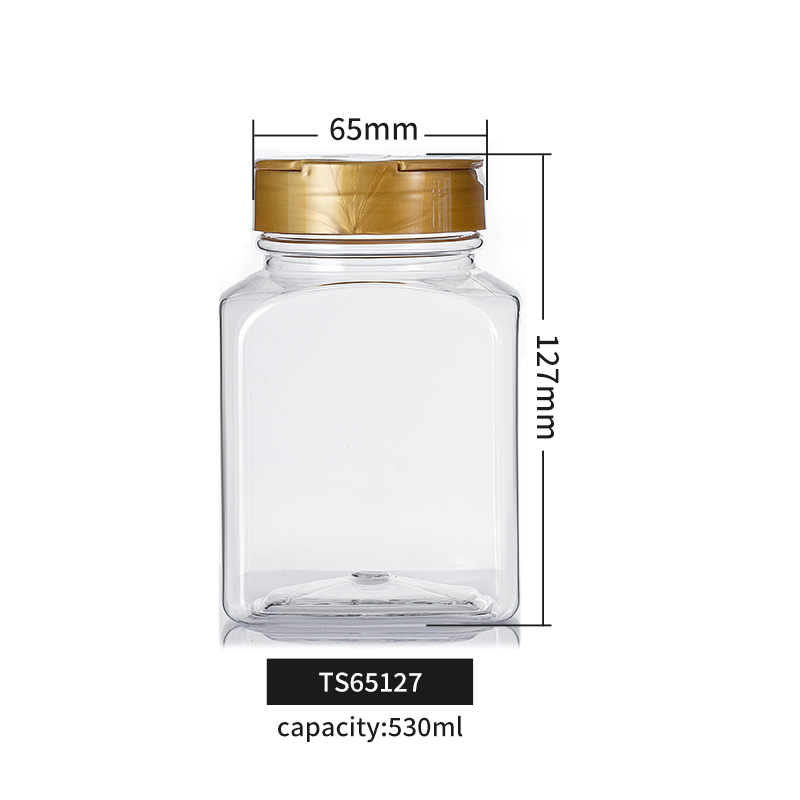
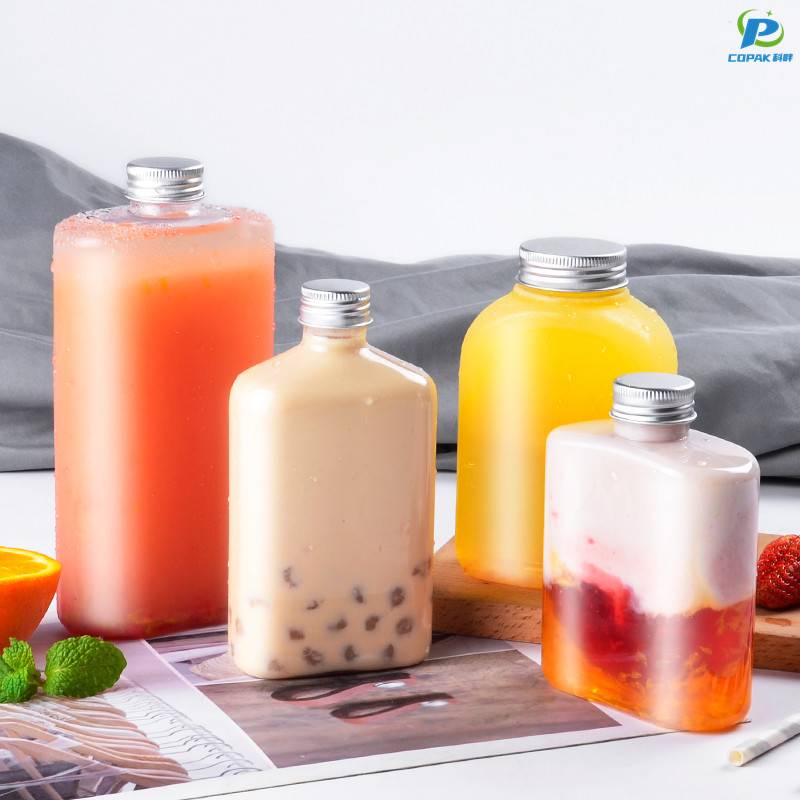
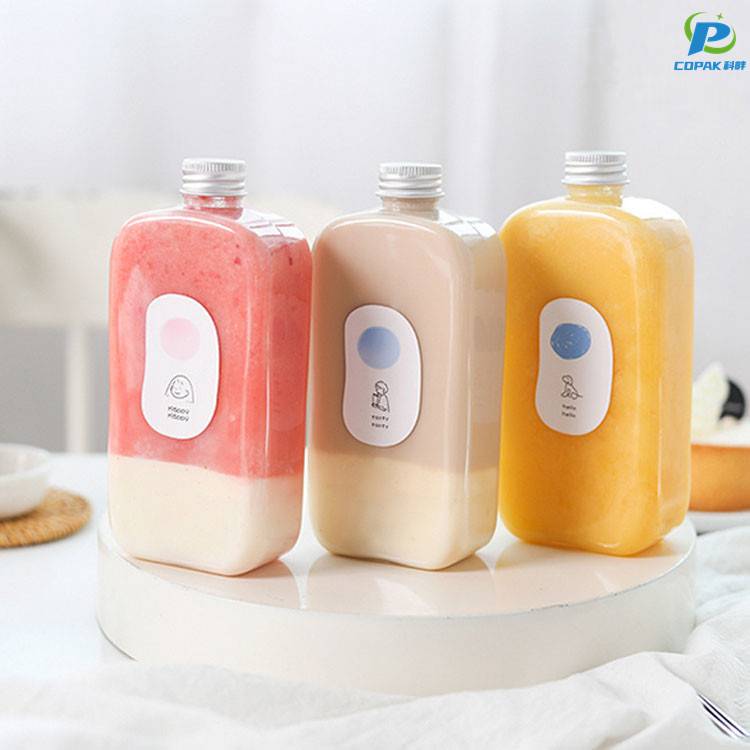


Empty Plastic Bottles Manufacturer Service Backed by Expertise
Top Selling Products





- Related Blog
- Reviews
- Reviews
