




Kraft Paper Bowls - China Manufacturer
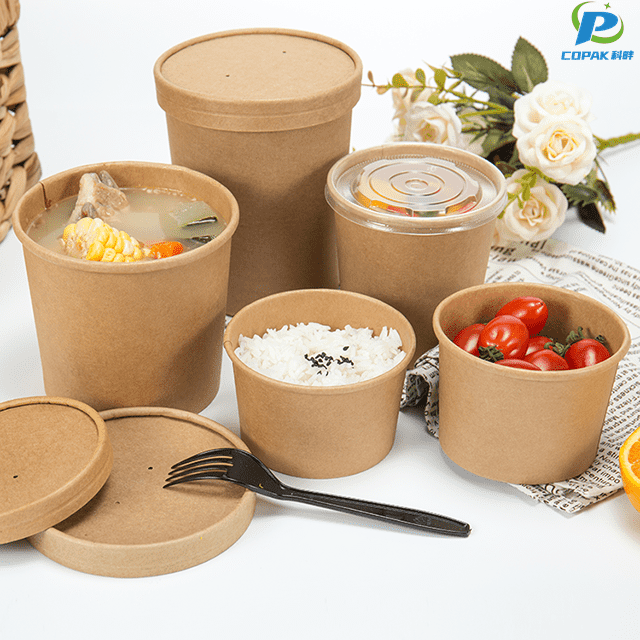
As a China-based manufacturer, I bring you Kraft Paper Bowls designed for performance and profit. I ship to food-service buyers who value reliability, consistent sizing, and compostable packaging. My Kraft Paper Bowls resist leaks, stay stiff when filled with hot soups, stews, or toppings, and stack neatly for fast service. Made from eco-friendly paperboard with a grease-resistant liner, they meet everyday kitchen demands while giving your brand a natural, premium look. I offer multiple sizes and custom printing options to match your menu and marketing needs. For B2B purchasers, I provide steady supply, competitive MOQs, and rapid lead times, plus dedicated support in China and overseas. Choosing my Kraft Paper Bowls means fewer returns and happier customers. If you are a distributor, retailer, or restaurant chain seeking a trusted China manufacturer, let's talk about how we can grow together.


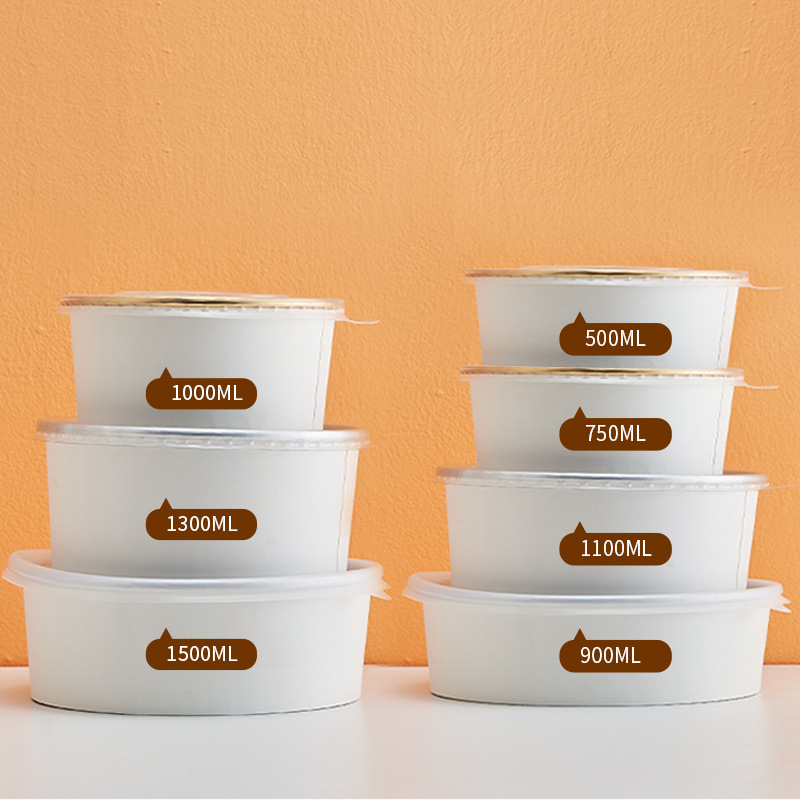
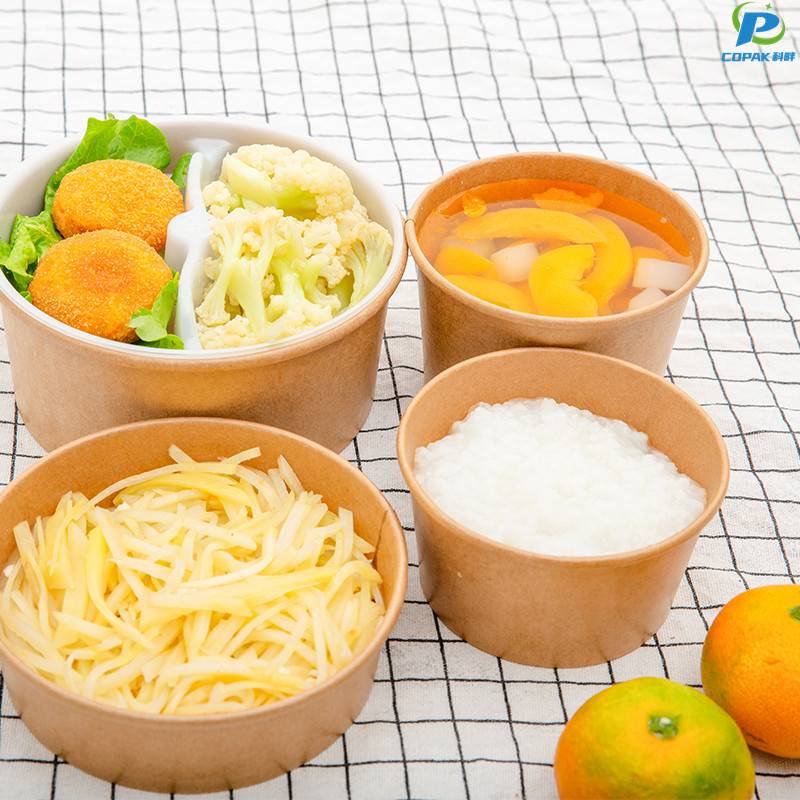

Kraft Paper Bowls Manufacturer in 2025
As a Shanghai-based kraft paper bowls manufacturer, we deliver durable, food-safe and compostable tableware engineered for modern foodservice and retail demands. Our 2025 range uses sustainably sourced kraft fiber with eco-friendly coatings or uncoated options for full compostability, offering leak resistance, stable stacking and high printability for custom branding. Sizes, shapes and barrier solutions are optimized for hot and cold applications while meeting international food-safety and sustainability standards. Backed by scalable production lines and rigorous quality control, we provide flexible MOQs, fast prototyping, reliable global shipping and tailored packaging to suit retail, delivery or catering needs. Competitive pricing and responsive supply-chain coordination ensure timely deliveries as demand grows for greener disposables. We welcome global buyers to request samples and explore customized solutions that balance performance, compliance and sustainability.
| Region | Avg Annual Production Capacity (million bowls) | Primary Material Source | Typical Bowl Sizes (oz) | Avg Wall Thickness (mm) | Avg Bowl Weight (g) | Common Manufacturing Processes | Typical Certifications / Standards | Compostability Standard | Post-consumer Recyclability | Renewable Energy Share (%) | Typical Lead Time (weeks) | Export Share (%) | Primary End Markets | R&D Focus |
|---|---|---|---|---|---|---|---|---|---|---|---|---|---|---|
| Asia | 1,500 | Unbleached kraft pulp (virgin & blended recycled) | 8, 12, 16, 24 | 0.45 | 18 | Die-cut forming, hot-air sealing, water‑based barrier coatings, PLA lining | ISO 9001, ISO 14001, FSC Mix, EN 13432 | EN 13432 (industrial composting common) | Recyclable where uncoated or where de-coating available | 20 | 6–8 | 70 | Quick‑serve restaurants, street food vendors, retail prepared meals | Barrier coatings, fiber blends for strength, scale optimization |
| Europe | 400 | Higher share of recycled kraft & certified virgin | 8, 12, 16 | 0.40 | 20 | Forming, solvent-free coatings, ultrasonic sealing, PLA/biopolymer laminates | FSC, PEFC, EN 13432, ISO 14001 | EN 13432 / OK Compost industrial | Good where mono-paper (uncoated) or compostable coating used | 45 | 4–6 | 50 | Meal delivery, catering, supermarkets, eco-focused foodservice | PCR incorporation, industrial compostable barriers, lifecycle impact reduction |
| North America | 350 | Predominantly virgin kraft with increasing recycled content | 12, 16, 24 | 0.48 | 25 | High-speed forming, grease-resistant coatings (PFAS-free development), heat sealing | ISO 9001, FDA food-contact compliance, ASTM D6400 / D6868 | ASTM D6400 (industrial composting); growing certified alternatives | Variable — depends on local recycling and de-coating capability | 30 | 6–8 | 40 | Quick-service restaurants, meal kits, institutional catering | PFAS-free grease barriers, material substitution, supply-chain traceability |
| Latin America | 120 | Local unbleached kraft and mixed recycled fibers | 8, 12, 16 | 0.42 | 22 | Die-cutting, hot-air sealing, water-based coatings | ISO 9001, FSC (where certified sources used) | Industrial composting available in select markets | Limited in many regions; improving with regional collection | 15 | 8–12 | 30 | Street vendors, small chains, retail ready meals | Local fiber sourcing, cost‑effective compostable coatings |
| Middle East & Africa | 80 | Mostly imported kraft pulp; some regional recycled inputs | 8, 12, 16 | 0.50 | 26 | Basic forming lines, hot-seal, manual finishing in smaller plants | ISO 9001 common; select facilities pursuing additional standards | Compostability infrastructure limited; certification possible for exports | Generally limited; depends on urban recycling programs | 10 | 10–14 | 20 | Local catering, events, expanding QSR market | Process reliability, import substitution, basic material improvements |
Related Products



Kraft Paper Bowls Supplies the World\u2019s Top Brands Service Backed by Expertise
Top Selling Products




- Related Blog
- Reviews
- Reviews
