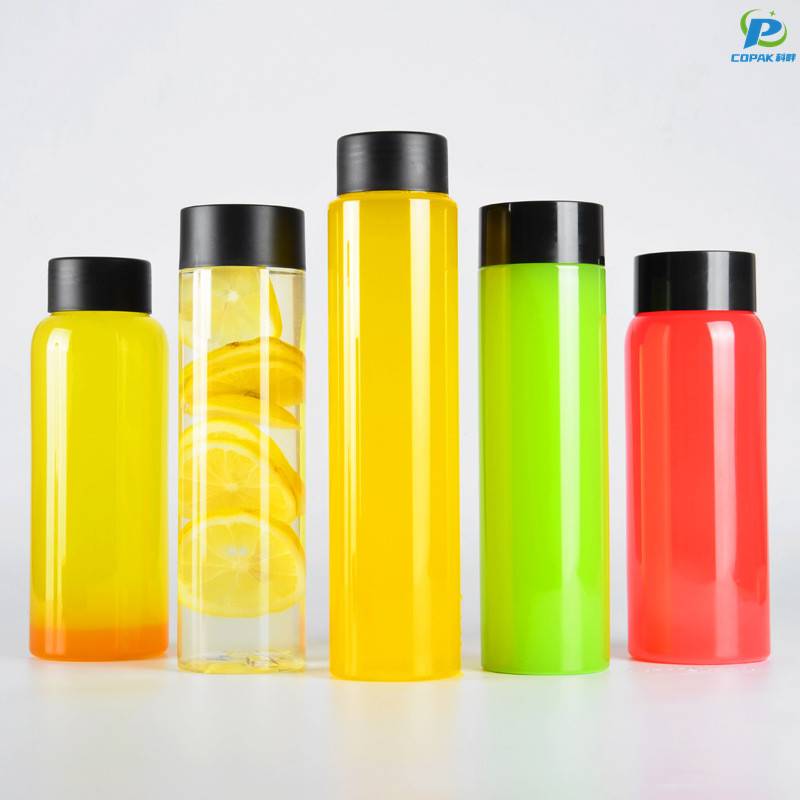
PET Bottles

PET Ice Cup - China Manufacturer for Durable PET Ice Cups

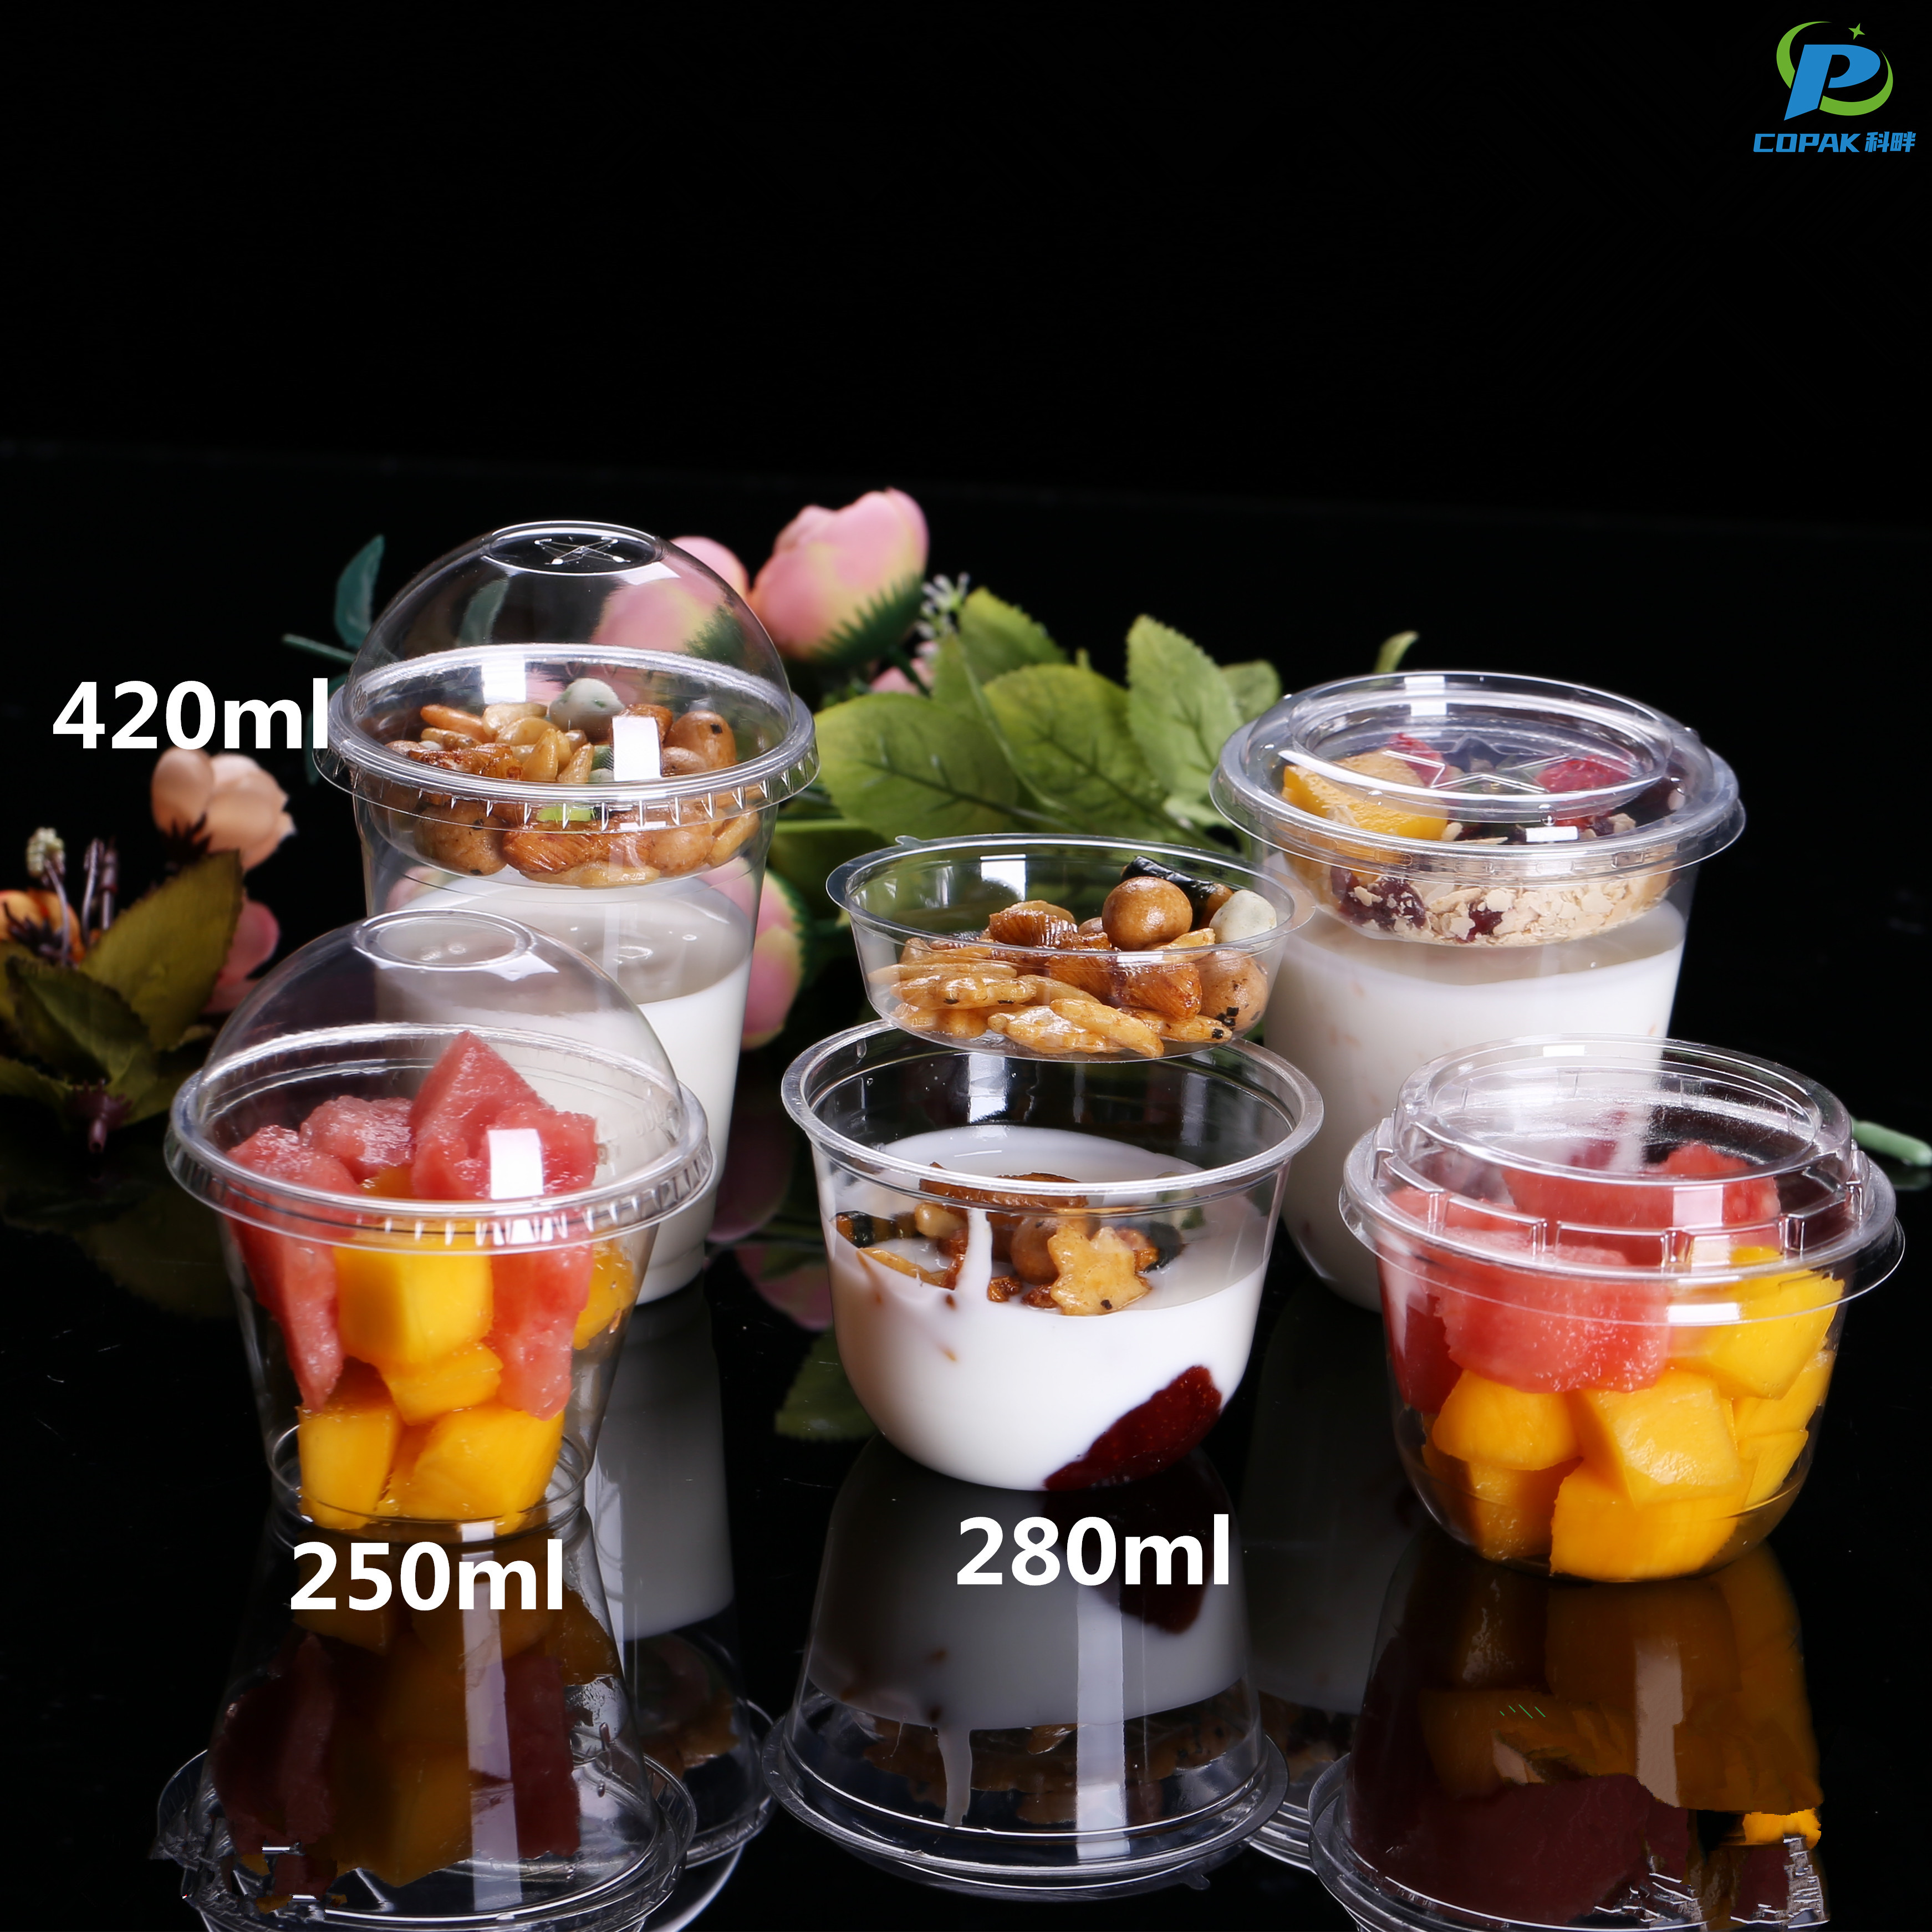
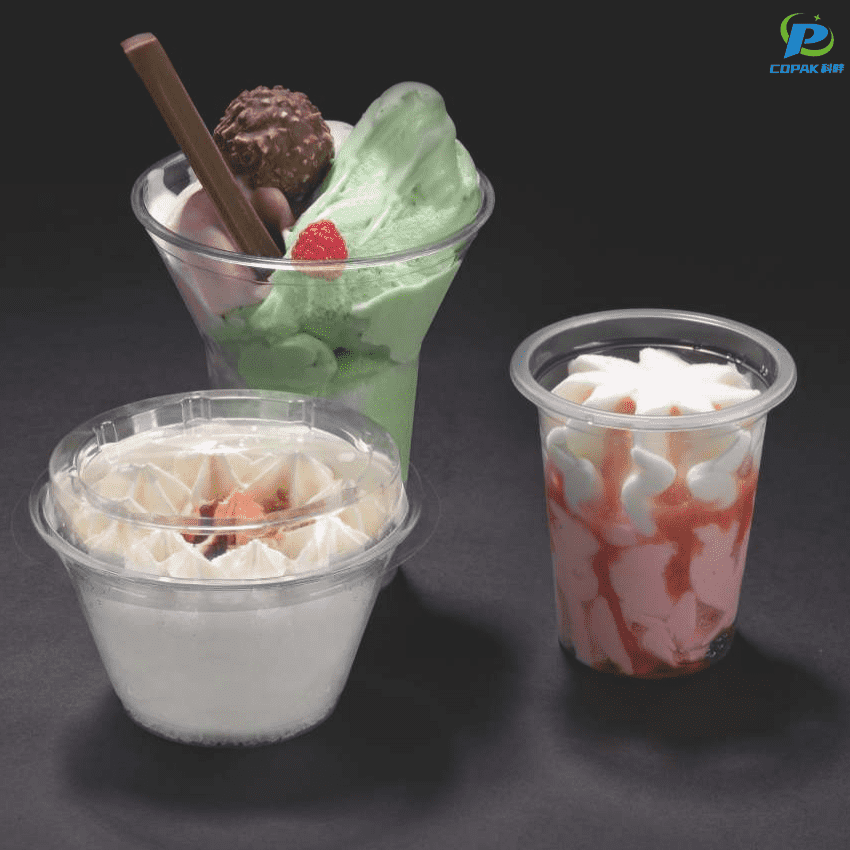
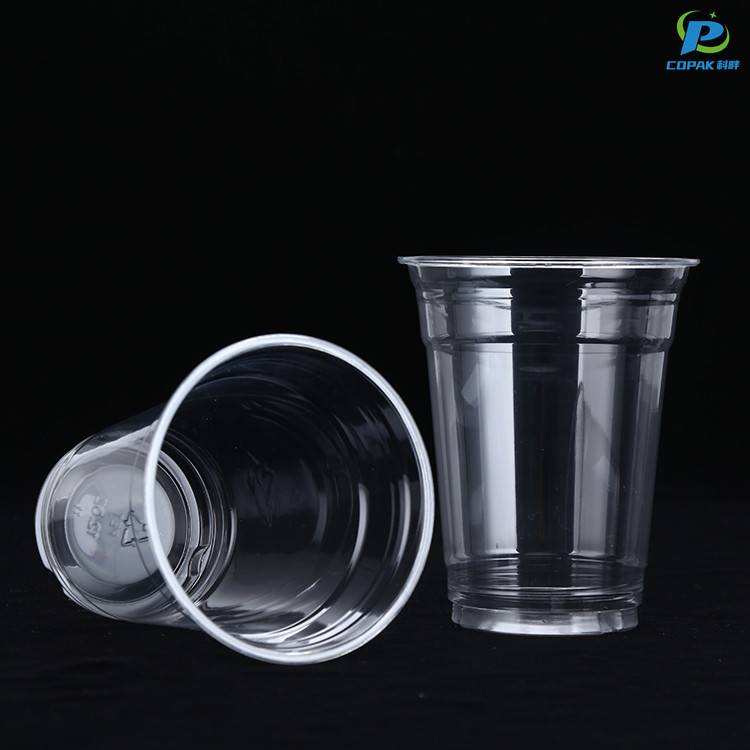
I’m a China-based Manufacturer, and I’ve spent years supplying PET Ice Cup to retailers and F&B businesses worldwide. You’ll find our PET Ice Cup crystal clear, lightweight, and strong enough to hold beverages without cracking. We design for easy stacking, smooth rims, and comfortable grip, so your customers enjoy every sip. Being in China gives me reliable access to a scalable, cost-efficient supply chain, short lead times, and flexible customization options—logo printing, multiple sizes, and assorted colors. I follow strict food-grade standards and can provide documentation for audits and certifications. For B2B buyers, I offer competitive pricing, consistent stock, and MOQ-friendly terms. If you are looking for a dependable partner to grow your brand with reliable PET Ice Cup, I’m ready to work with you, build long-term relationships, and meet your demand as a trusted manufacturer.

Hot Selling Product

PET Ice Cup Industry Giant Market Leader

As a recognized industry giant and market leader in PET ice cups, we deliver high-volume, consistent-quality solutions for beverage brands, event planners and retail chains. Our PET cups offer crystal-clear clarity, impact resistance and excellent cold tolerance, produced from food-grade materials that meet global safety standards. Advanced automation and rigorous quality control ensure uniform wall thickness, leak-free rims and precise dimensions for reliable stacking and lid compatibility. Global procurement teams benefit from scalable production capacity, flexible OEM/ODM customization (sizes, colors, printing and recycled-PET options), competitive lead times and transparent pricing models. Certified manufacturing, experienced export logistics and proactive account support simplify bulk or seasonal sourcing—request samples and technical specifications to evaluate fit for your supply chain and brand needs.

{ PET Ice Cup Industry Giant Market Leader}
Parameter Typical Value Unit Notes
Product category Rigid cold‑beverage cups Single‑use PET cups primarily for iced drinks and cold desserts
Base polymer Polyethylene terephthalate (PET) Widely used for clarity, strength and barrier properties
Resin identification code 1 Standard recycling code for PET
Density 1.38 g/cm³ Typical bulk density for PET polymer
Glass transition temperature (Tg) ≈67 °C Above Tg, material becomes less rigid; affects shelf performance with warm liquids
Melting temperature 250–260 °C Relevant to thermoforming and reprocessing
Recommended maximum service temperature ≤60 °C Primarily suitable for cold or chilled beverages; not recommended for sustained hot liquids
Common cup capacities 200, 300, 355, 473, 591 ml Typical market sizes (8,10,12,16,20 oz equivalents)
Typical wall thickness 0.18–0.35 mm Depends on required rigidity and thermoforming draw depth
Primary production methods Thermoforming & injection molding Thermoforming from PET sheet is common for single‑use cups
Global PET resin production (2023 est.) ≈30 million tonnes Includes bottles, trays and rigid packaging feedstock
Estimated annual PET cup production 20–60 billion units Range reflects global variation and data aggregation differences
Market growth (CAGR 2023–2028) ≈4.0 % Estimated CAGR for rigid PET packaging segments
Largest single‑firm market share (top‑tier) 12–18 % Typical range for a market leader in a consolidated global segment
Post‑consumer recycling rate (region‑dependent) 20–60 % Wide variation by region and collection infrastructure
Mechanical recycling yield per cycle 85–95 % Mass retention after typical mechanical reprocessing (varies by contamination)
Cradle‑to‑gate carbon footprint (PET resin) 1.8–2.5 kg CO2e/kg LCA range depending on feedstock and energy mix
Typical appearance Transparent / clear High clarity is standard for iced beverage presentation
Main end‑use segments Cold beverages, desserts, samples Foodservice and retail single‑use applications
Regulatory considerations Food‑contact compliance required Must comply with applicable regional food‑safety standards for polymers
Supply‑chain risks Feedstock volatility; collection infrastructure Resin feedstock price swings and recycling collection capacity are primary risk drivers
Typical bulk lead time 4–12 weeks Depends on tooling availability, region, and order complexity

Related Products

PET Cups

PET Ice Cup Industry Leaders Supplies the World\u2019s Top Brands

Regional PET Ice Cup Supply vs Demand Forecast (2025, Million Cups)

This chart presents a forecasted supply and demand comparison for PET ice cups across five global regions for 2025. Supply values represent annual production capacity in millions of cups, and demand values reflect projected consumption. The visualization highlights imbalances between capacity and market needs that may influence logistics, pricing, and investment strategies. In North America, production slightly exceeds demand, indicating available export potential but also possible pressure to optimize domestic distribution. Europe shows demand outpacing supply, suggesting opportunities for capacity expansion or import reliance. The Asia-Pacific region dominates both production and consumption, with demand marginally higher than supply; this indicates a tight market where manufacturers may prioritize local allocation, triggering regional price sensitivity. Latin America has modest production just above demand, while the Middle East & Africa displays the largest relative undersupply, implying a strong case for targeted investment in manufacturing capacity, supply chain resilience, or increased import flows. These regional patterns have practical implications: manufacturers should align capacity planning with regional demand trajectories; distributors can identify deficit markets for strategic growth; and sustainability initiatives around PET recycling and circular packaging will need to be regionally tailored. For example, regions with oversupply can focus on export and recycling infrastructure, whereas under-supplied regions may benefit from supply diversification and demand management initiatives. While numerical forecasts carry uncertainty due to raw material prices, regulatory changes, and shifting consumer behavior, the bar chart provides a clear baseline for stakeholders to prioritize actions, monitor market shifts, and model scenarios such as capacity upgrades, tariff changes, or rapid demand growth in key regions. Use this visual as a starting point for deeper supply chain analyses and scenario planning. Periodic updates and sensitivity testing with alternative raw material pricing and recycling rates can refine these projections and support agile commercial decision-making across regional hubs and timeframes.

Top Selling Products

Subscribe To Our Newsletter

For inquiries about our products or pricelist, please leave your email to us and we will be in touch within 24 hours.

Follow Us

on our social media
  • whatsapp (1)
  • instagram
  • youtube